Inverter Production Curves: South vs A-Frame

For the first day this year, I’ve got absolutely clean production curves for the house array , and thought I’d share. This was a 69-70kWh day, absolutely clear skies, with enough wind to keep the array quite cool in operation.

First, the south array. This is a south facing, 45 degree array, with 6 panels, that produces a very “normal” solar curve - a smooth arc throughout the day. The morning side of the curve tends a bit higher than the evening side, as the panels are colder in the morning. The difference between 0C and 15C on my panels is about 6%, and you can notice it in the curves. Scale here is half the scale for the others, vertically - it peaks around 1.7kW. Production today was 12.29kWh, or 2.04kWh/panel.

inverter_north

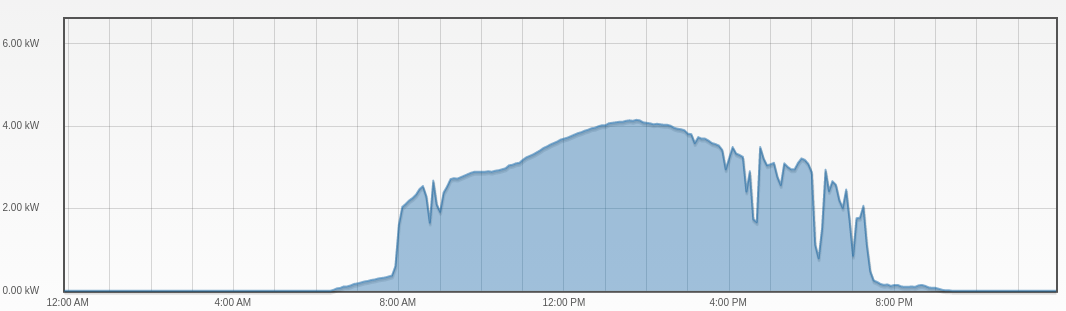
Next, my west frame. This frame is the west one, and due to the slope of our hill, is somewhat lower than the east frame, meaning it’s shadowed in the morning as the sun rises. The “chunk” missing out of the left is from shadows, and it produces almost nothing while a strip of shadow climbs down it. I was aware they’d self shade slightly like this, and it doesn’t bother me. You can see the far, far flatter production curve spread across the day. It comes online far earlier and holds a far greater amount of power until the sunset. During the summer months, this should be holding power from 6:30 AM until 9PM. Production today was 28.58kWh, or 1.19kWh/panel.

inverter_west

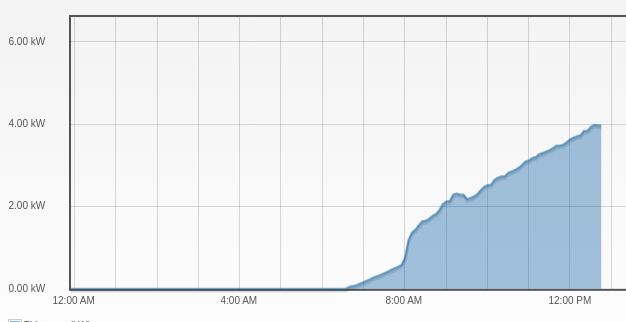
The east frame is the reverse, being shadowed in the evening. However, being a bit higher, it holds power longer into the evening and has less of a cutoff than the west frame. Moving enough dirt or building the frames higher to make them exactly level didn’t seem worth the effort… Total production today was 29.79kWh, or 1.24kWh per panel.

inverter_east

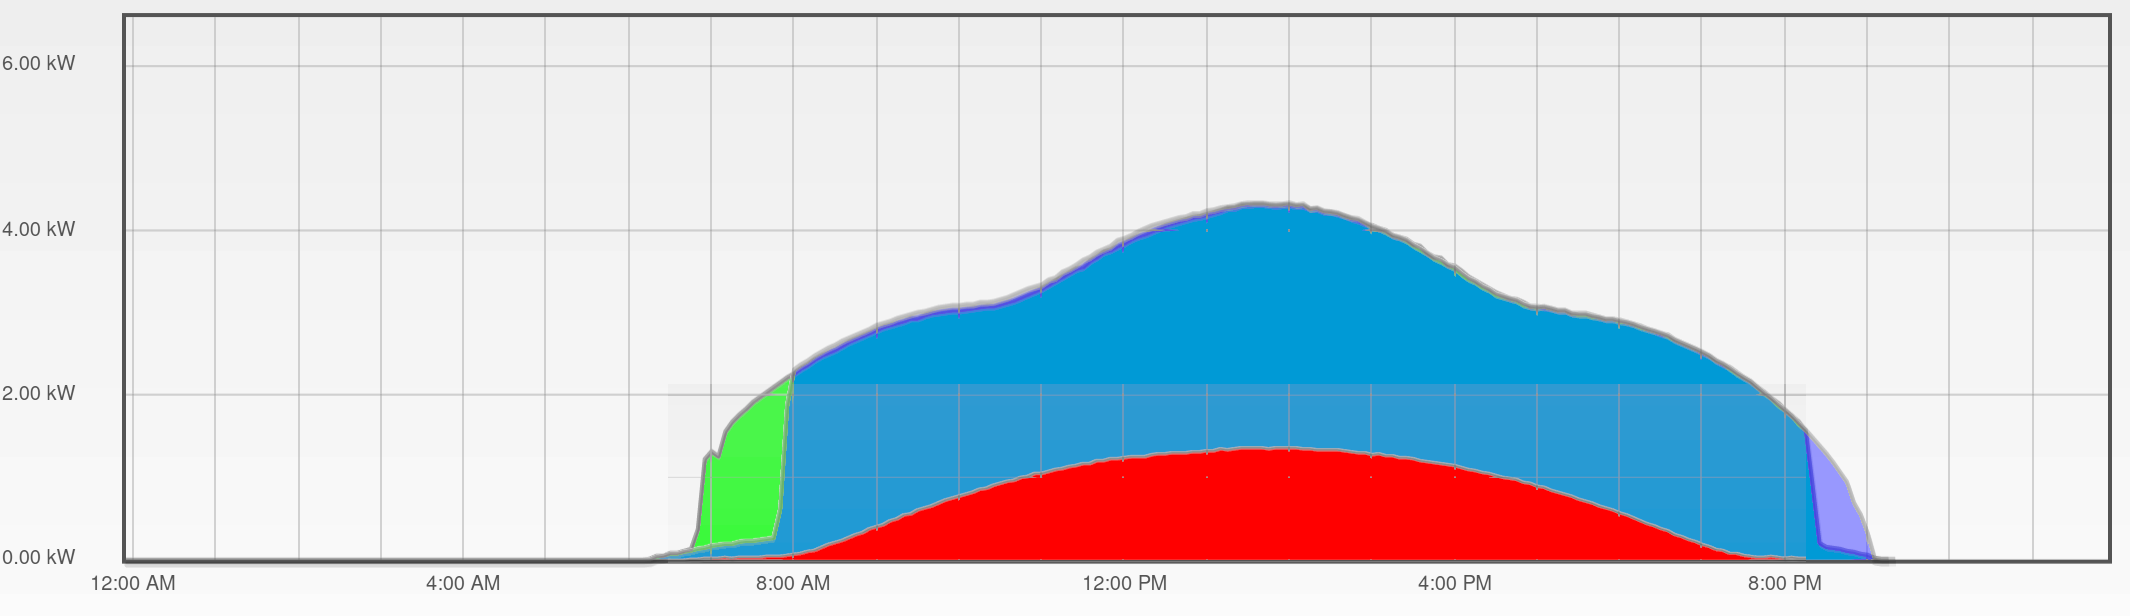
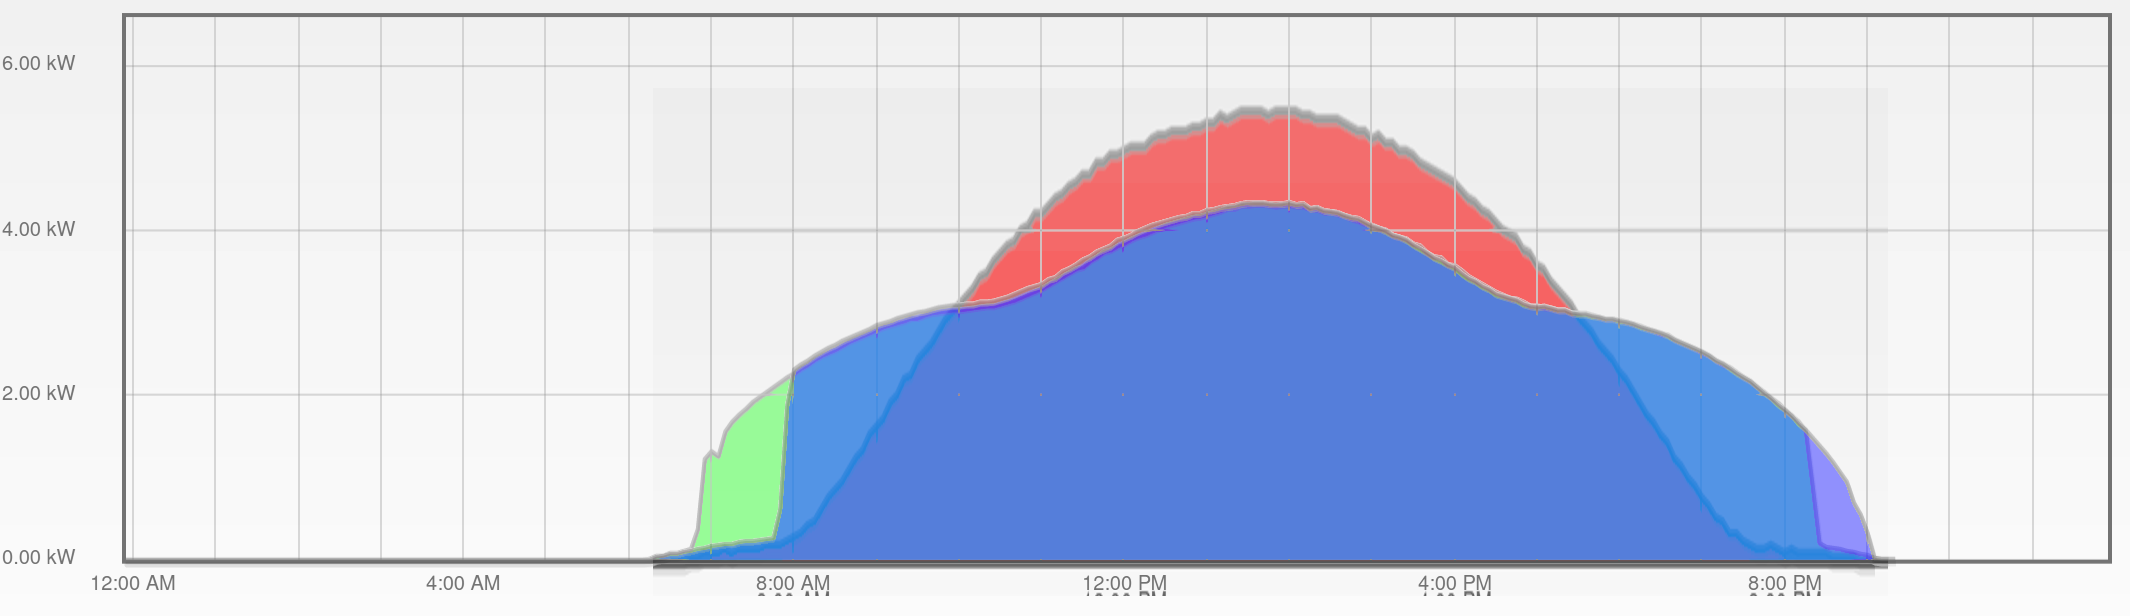
Summing them all together, this is roughly what my power curves look like. It’s a weird, multi-lobed curve that definitely has some early/late power generation benefits, but the real benefits of the east-west panels are going to be during summer demand - they’ll be generating strongly while the south array is still backlit (I run into this on my south facing office panels for a good chunk of the summer). At the peak of summer, there will be another 2 hours on each side of the curve. You can also see the very real difference in the morning and evening lobes.

I knew the system would still be peaking mid-day like this, and while not as bad as a pure south facing system in terms of “percenage of power generated mid-day,” my original assumption was that the EV charging would be happening mid-day. Before Covid, my wife frequently went into town with the kids for something or other in the morning, coming back around 11 or noon. A few hours of 3.3kW charging mid-day would trim down that fat mid-day peak, better matching grid curves. We just don’t drive much anymore…

inverter_total

Enjoy!

3 Likes

And, while the curves aren’t quite as nice with the random clouds we’ve had lately, we are pushing a nice surplus back to the grid.

Peak “forward draw” on the meter looks to have been about 3MWh - it was up to 3.1MWh for a while, but based on billing cycles, which is how they calculate kWh credit, it was only a hair over 3MWh.

So, now to roll that back over the year and build up a kWh credit for next winter!

Excellent. Exporting consistently now! Those lower bars are in the 20-30kWh range, depending on the day.

image

Nice, is that temperature data recorded by local instrumentation or downloaded from somewhere?

That’s just off the power company website - I’m not sure what they use exactly.

I’ve exported over 500kWh net in the last month, though!

Ooooh…

47kWh exported on Sunday on 80kWh generated. Bump at noon is EV charging after church.

image

It’s funny seeing negative and trying to square that with your words. Isn’t that a bad thing? And then reorienting myself in the graph and realizing that’s power at the meter,so negative is good because that’s power back out to the grid.

Yeah, negative is “exported to the grid.”

System is actually overproducing the PVWatts estimates by a good margin (15-30%), far as I can tell. The panels do need some cleaning after a recent storm that kicked up a ton of dust, rained it out, and lit a corner of the hillside on fire (power line went down in the wind after arcing to a guy wire from another line)…

But we should get a 500-600kWh credit this billing cycle - woo!

Overproducing estimates is nice :slight_smile: Would be fun to time you washing off the panels and seeing if there’s a significant, noticeable lift in production. Is a slight film of dust that impactful or not really until it’s a significant amount of coating.

Another plus for ground mounted panels. Easy cleaning!

Run down the line with a good hose nozzle would probably get it most of the way clean enough.

Aw yeah. 763kWh pushed net on the last bill.

image

Pushing 40-45kWh on any good sunny day right now that doesn’t involve driving, on 80-85kWh generated.

More clean curves, from a month and a half after the previous set!

apr_north_inverter

apr_east_inverter

apr_west_inverter

apr_combined_inverter

And, while not absolutely peak of summer, close enough that I can do some merged graphs.

This is a clean day’s production scaled to match - red is the south facing panels. You can see how much longer the day is for the east/west frames as compared to south. The “cuts” at either end are from the frames shading each other. The east frame is higher than the west frame, which is why the morning cut is larger than the evening cut (this worked with the terrain and I’m not going to complain about longer evening production).

However, the south frame is only 6 panels, vs the 24 on each of the big As. If I scale the south production up by 4x, I have a synthetic curve that would be what 24 south facing panels would produce (compared to the As). It actually works out, in the peak sun of summer, they produce the same amount. It’s just spread further out for the A frames, and extends the solar day into far more useful times than “solar noon.”

Very cool. I was just checking on whether you’d fixed the Solar Stats ‘tab’ of the homepage.

I have not, I should just remove it for now. It’s intended for embedding, but whatever Sunny Portal is doing doesn’t reliably work. I’m beating on some code that should do it based on local extraction, but it’s not working reliably and I don’t really feel like beating out quirks in weird Python code right now. I’d rather beat on the dirt, at least it’s not a computer. :slight_smile:

Gave up on embedding and now Solar Stats just links directly to the public Sunny Portal page.

https://www.sunnyportal.com/Templates/PublicPageOverview.aspx?plant=ed90b054-e859-4dd9-b6cc-38f775511c3c

It should, unlike the previous version, actually work!

Are you seeing any effect on production of the increasing ambient temperatures, on peak or daily production?

Yeah, production numbers are down a bit and you can see this in the charts - https://www.sevarg.net/solar.html should get you there.

In the late spring, with cooler days and insane amounts of wind, I was producing 95-100kWh/day. Now, even with longer days (slightly, but still longer), I’m producing 87-91kWh, and heat is certainly one of the reasons for this.

However, we’re still exporting 40-50kWh/day, and avoiding too much grid draw during peak hours. We might see a bit more spike than usual in the 10PM hour, but between running the house hot (which… we compromise at 78-80 these days, I’d prefer cooler along with the ferrets, my wife would prefer a bit warmer) and the solar, things are mostly working fine. I’m running the meter backwards at a good clip still.

This week will be the real test, since we have 100+ all week, but I see no reason that it should be much different from last week. Likely 85-90kWh production and 50-60kWh consumption, for 30-40kWh export.

Smoke… gross.

Production is down to about 80kWh/day with the heavy smoke, but the diffusion of light is interesting.

This is my west inverter on a day without much smoke - look at the morning rise before it becomes unshaded. It’s just getting diffuse light.

Today, with heavy smoke, that rise is more rapid, from the better diffused light.

I need to check the backside production as well - the “fully shaded” panels ought to be producing more in the morning/evening.

But this smoke sucks. :frowning:

smoke_curve

Huh. That was interesting.

Lessons learned:

  • Yes, the Sunny Boy arc fault detection works, and is quite sensitive.
  • No, it will not show up in the user event logs.

A week or so ago, I noticed a blip on one of the array curves that didn’t really make much sense. Logged in, looked at the event logs, saw something related to what looked like a firmware update or something, which seemed odd mid-afternoon, but… OK. Nothing serious, decided it was probably just a reporting glitch, and went on my way.

Except it happened again today, and that’s worth investigation. Still nothing in the user event logs… try installer? Oh. Hey. Arc fault warning. Yeah, that’s one to check! Conveniently, it tells you which string it detected it on, so I shut down the DC side and inspected all the wiring on that string (did I mention ground mount is easier to do maintenance on?), nothing looked wrong - no signs of any thermal distress or such.

Well, the most likely place for a glitch would be joints, so I checked the inverter side connections, nothing loose. However, taking a screwdriver to the screw terminals over at the array side fuse box (carefully, since it’s live but isolated), one of the connections between the touch safe fuse holders and the run up to the inverter was not as tight as it should have been. On the indicated string. Again, zero visual signs of any damage, but I pulled the wire and reseated it, tightened it down. We’ll see if that fixes it, but it’s something that would have caused the indicated fault, on the indicated string, so… chances are good that was the issue.

I’m just really annoyed that sort of warning doesn’t show up in the user login section. That’s an important warning, not a “Grid voltage out of spec” type thing. And if there’s a glitch in production, I should be able to see why without needing installer credentials.